Data Analytics Transforming Visual Promotions for Online Wagering Sites
Bianca Vogel · Aug 20, 2026
Data Analytics Transforming Visual Promotions for Online Wagering Sites
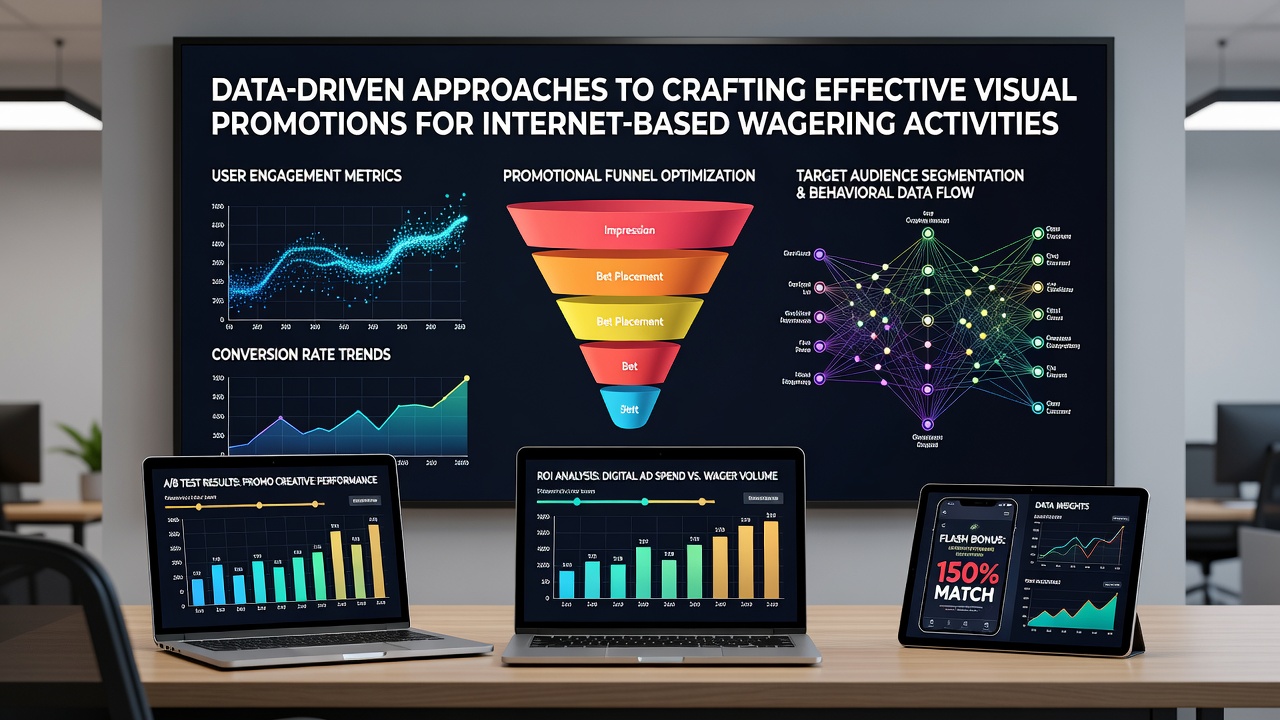
Platforms operating internet-based wagering activities have turned to data analytics to refine visual promotions that reach users through banners, pop-ups, and landing pages, and research indicates these methods rely on tracking click-through rates, session durations, and conversion patterns to adjust imagery, typography, and layout elements. Observers note that companies collect anonymized user interaction data from multiple channels including mobile apps and desktop sites, then apply segmentation techniques to group audiences by geographic location, device type, and previous engagement history. This process allows for iterative updates where visual elements such as button colors or promotional graphics are tested against control versions, and studies from academic institutions have shown measurable lifts in user response when designs align with observed preferences rather than static creative choices.
Core Data Sources and Collection Methods
Effective campaigns begin with integration of first-party data from registration forms, game play logs, and marketing touchpoints, while third-party tools supply broader market benchmarks on ad performance across digital channels. Those who manage these systems often combine heat map analysis with A/B testing platforms to identify which sections of a promotion receive the most visual attention, and data shows that scroll depth metrics frequently correlate with higher deposit rates when images feature dynamic elements like spinning reels or live event tie-ins. Regulatory bodies in various regions require transparent consent mechanisms for data use, and this framework influences how visual assets are deployed without crossing into personalized targeting that violates local statutes. In August 2026 industry reports highlighted expanded use of privacy-preserving analytics methods that maintain compliance while still delivering actionable insights for creative teams.
Personalization Through Segmentation and Testing
Segmentation models divide audiences into cohorts based on behavioral signals such as frequency of play or preferred game categories, and these groupings inform decisions about whether a promotion should emphasize high-contrast colors for quick recognition or detailed illustrations for deeper storytelling. Researchers discovered that dynamic creative optimization systems, which swap visual components in real time according to incoming performance data, produce consistent improvements in engagement metrics across multiple jurisdictions. Experts have observed that multivariate testing expands beyond simple color swaps to include variations in headline length, icon placement, and animation speed, yet all variations must remain within approved brand guidelines and legal advertising standards enforced by authorities outside the United Kingdom. One documented case involved a European operator that adjusted banner imagery for sports betting events by analyzing live traffic data during major tournaments, resulting in updated visuals that reflected current odds movements without manual intervention.

What's interesting here is how machine learning models trained on historical campaign results now predict which design combinations will perform best for new user segments, and this predictive layer reduces the number of live tests required before rollout. Industry organizations such as the American Gaming Association have published aggregated findings on digital marketing efficiency, noting that data-informed visual strategies tend to outperform generic templates when operators maintain rigorous measurement protocols. Australian research centers have contributed similar analyses focused on mobile-first promotions, where screen size constraints demand tighter integration between data signals and visual hierarchy decisions.
Measurement Frameworks and Performance Indicators
Key performance indicators extend beyond surface-level clicks to include downstream actions such as account verification completion and first-time deposits, and platforms track these through attribution models that assign credit across multiple visual touchpoints in a user journey. Observers note that lift studies comparing exposed versus control groups provide clearer evidence of visual promotion impact than simple before-and-after comparisons, and the results often guide budget allocation toward formats that demonstrate sustained performance rather than short-term spikes. Those who've implemented unified dashboards report that combining web analytics with customer relationship management records allows creative teams to correlate specific design features with lifetime value metrics, creating feedback loops that refine future iterations. Data from regulatory filings in Canada and parts of the European Union further illustrates how transparency requirements shape the types of visuals operators can deploy, particularly when promotions reference bonus structures or game outcomes.
Emerging Techniques and Regional Variations
Advanced methods now incorporate computer vision algorithms that evaluate proposed visual assets for compliance risks before launch, scanning for prohibited language or imagery that could trigger regulatory scrutiny. People managing promotions across borders must reconcile differing rules on responsible gambling messaging, and data platforms help automate placement of required disclaimers within approved visual zones. A study released through university partnerships in North America examined how seasonal event tie-ins affect visual engagement in wagering promotions, revealing patterns that operators can apply when planning campaigns around major sporting calendars. Yet the core remains consistent: continuous data collection and analysis drive adjustments that keep visual promotions aligned with evolving user expectations and platform performance goals.
Conclusion
Operators continue to refine these data-driven processes as new measurement tools and regulatory expectations emerge, and the result is a cycle where visual promotions evolve through evidence rather than intuition alone. Integration of analytics across design, deployment, and review stages supports more precise targeting of internet-based wagering audiences while respecting geographic and legal boundaries. Those who monitor performance indicators over extended periods find that sustained attention to data signals produces incremental gains that compound across multiple campaign cycles.