Decoding Engagement Rhythms in Digital Gaming Networks
Hugo Bauer · Jul 7, 2026
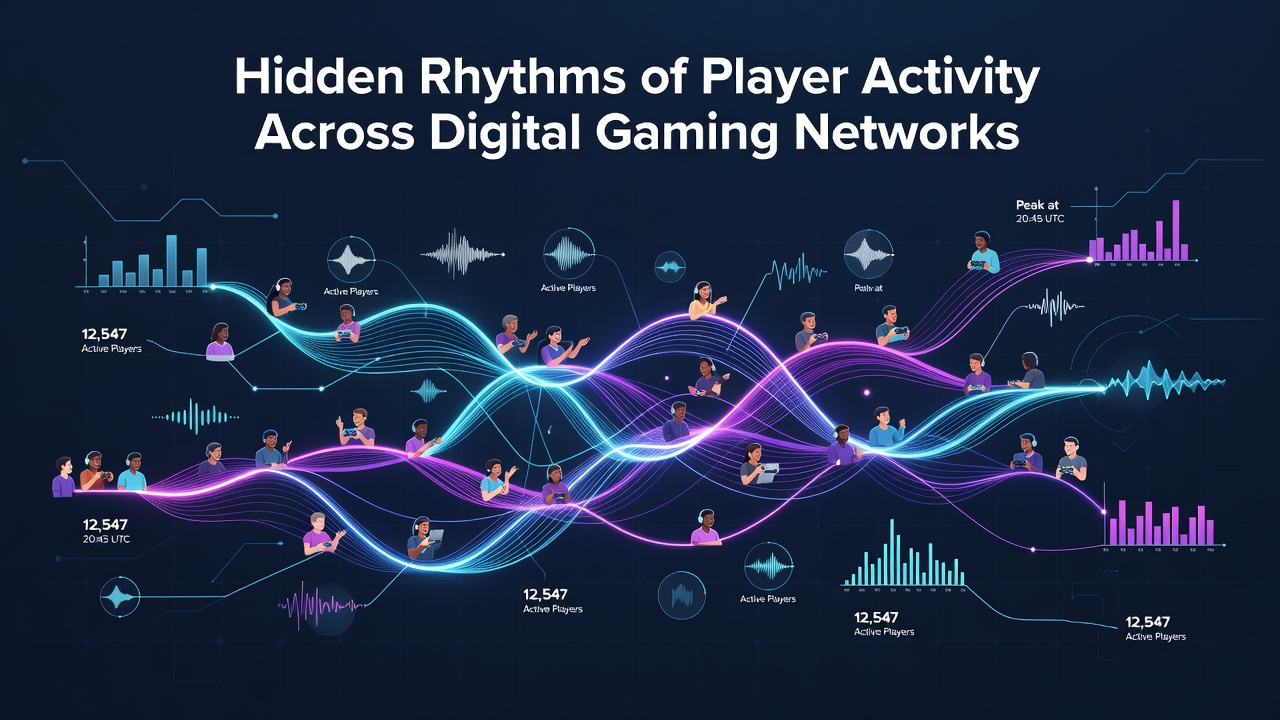
Decoding Engagement Rhythms in Digital Gaming Networks
Digital gaming networks reveal distinct temporal structures in how participants interact with platforms, with login frequencies, session durations, and transaction volumes following observable cycles that researchers have tracked through large-scale data analysis. These patterns emerge across time zones, device types, and game categories, creating predictable surges and lulls that operators monitor to adjust server loads and promotional timing.
Studies of aggregated user data show morning activity clusters concentrated between 6:00 and 9:00 local time in major markets, while evening peaks extend from 19:00 to 23:00 across multiple continents. Mid-week days register steadier engagement levels compared with weekend spikes, where participation can increase by 35 to 50 percent according to metrics compiled by regional regulators. Such variations reflect differences in work schedules, leisure availability, and regional holidays that influence when users access network resources.
Daily and Weekly Cadences
Hourly breakdowns collected from North American and European servers demonstrate that mobile sessions dominate early morning hours, whereas desktop and console logins rise sharply after traditional business closing times. Friday evenings produce the longest average session lengths, often exceeding 90 minutes per user, while Monday mornings show abbreviated interactions typically under 25 minutes. These rhythms persist across slot, table, and live dealer formats, though each category exhibits slight offsets in peak windows.
Weekly data further illustrates recurring drops on Tuesdays and Wednesdays, followed by gradual climbs toward the weekend. Operators have adjusted maintenance windows to align with these lower-activity periods, reducing service interruptions during high-traffic intervals. Geographic differences appear as well: Asia-Pacific networks register earlier evening surges relative to European counterparts, creating staggered global load distributions that help balance overall infrastructure demand.
Seasonal and Event-Driven Shifts
Longer-term observations spanning multiple years indicate elevated participation during winter months in northern hemispheres, with corresponding declines during summer vacation periods. Major sporting events, such as international tournaments, produce temporary deviations from baseline rhythms, sometimes sustaining elevated traffic for several consecutive days. In July 2026, analysts noted an unusual mid-month plateau coinciding with regional festivals, where activity levels remained 12 percent above historical averages for that week despite typical seasonal expectations.

Payment transaction rhythms closely mirror login patterns yet display additional granularity around payday cycles and promotional campaigns. Deposits cluster within 48 hours of common salary disbursement dates, while withdrawal requests peak mid-week following weekend play sessions. These financial cadences provide supplementary indicators that complement behavioral logs when mapping overall network dynamics.
Influencing Factors and Data Sources
Multiple variables shape these rhythms, including device penetration rates, broadband availability, and cultural attitudes toward leisure timing. Time-zone overlap between major markets amplifies simultaneous traffic, whereas regulatory changes can shift patterns abruptly when new restrictions alter operating hours or payment options. Research conducted by the Malta Gaming Authority has documented how policy adjustments in 2025 influenced session timing across Mediterranean-facing platforms, producing measurable redistribution of peak hours.
Academic teams at institutions such as the University of Nevada, Reno have contributed longitudinal analyses that compare activity across different regulatory environments, highlighting how tax structures and licensing conditions correlate with participation consistency. Their datasets reveal that jurisdictions with stable frameworks maintain more uniform weekly rhythms, whereas frequent rule changes introduce volatility into daily engagement curves.
Conclusion
Network operators and researchers continue to refine models that forecast these hidden rhythms, incorporating real-time telemetry with historical benchmarks to anticipate demand. The resulting insights support infrastructure planning, responsible gaming interventions, and content scheduling while preserving the underlying data integrity that makes such patterns visible in the first place. As digital gaming ecosystems expand, the ability to read these temporal signatures remains central to understanding collective user behavior across distributed platforms.